How to Create a Chart Patterns That Works
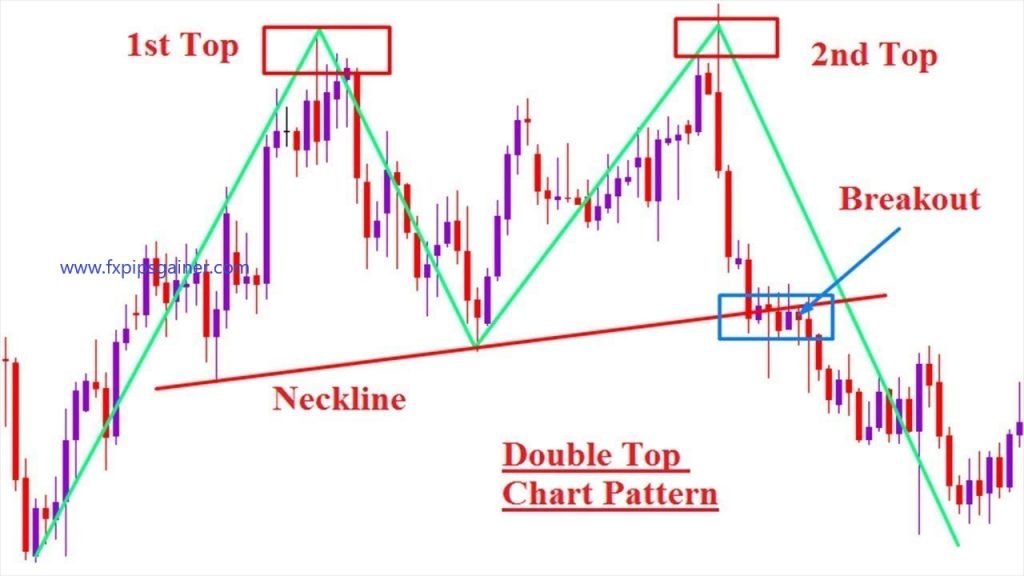
Chart patterns are essential tools for traders, helping to identify potential market movements and make informed trading decisions. Creating a successful trading strategy based on patterns requires a structured approach. Here’s a step-by-step guide to developing a chart patterns trading strategy that works.
Understand Chart Patterns
- Learn Common Patterns: Familiarize yourself with key chart patterns such as:
- Head and Shoulders: Indicates a reversal trend.
- Double Tops and Bottoms: Signals potential reversal points.
- Triangles: Indicates continuation patterns, including ascending, descending, and symmetrical triangles.
- Flags and Pennants: Short-term continuation patterns.
- Recognize Timeframes: Understand that patterns can form on various timeframes (daily, hourly, or minute charts). The timeframe you choose should align with your trading style.
Set Clear Entry and Exit Rules
- Entry Points: Define how you will enter a trade based on the completion of a pattern. For example, you might enter a long position once a bullish breakout occurs above the resistance level in a triangle pattern.
- Exit Points: Establish clear exit strategies, including take-profit and stop-loss levels. Consider using:
- Fixed Target: A predetermined risk-reward ratio (e.g., 2:1).
- Trailing Stops: To lock in profits as the price moves in your favor.
Incorporate Technical Indicators
- Complement Patterns with Indicators: Use technical indicators to confirm chart patterns and improve your strategy’s effectiveness. Common indicators include:
- Moving Averages: Help identify trends and potential support/resistance levels.
- Relative Strength Index (RSI): Indicates overbought or oversold conditions.
- Volume Analysis: Higher volume during a breakout can validate the pattern’s strength.
Develop a Risk Management Plan
- Determine Position Size: Use position sizing to manage risk effectively. Decide what percentage of your capital you’re willing to risk on each trade.
- Set Stop-Loss Orders: Place stop-loss orders just outside the pattern to minimize losses if the trade goes against you. For example, in a bullish pattern, set your stop-loss below the most recent swing low.
Backtest Your Strategy
- Historical Analysis: Test your strategy on historical data to evaluate its effectiveness. Identify how well the patterns performed in different market conditions.
- Adjust Parameters: Based on backtesting results, tweak your entry and exit rules, stop-loss placements, and risk management strategies as needed.
Practice with a Demo Account
- Simulate Trading: Use a demo account to practice your strategy in real-time market conditions without risking actual capital. This helps build confidence and fine-tune your approach.
- Track Performance: Monitor your trades to identify strengths and weaknesses in your strategy, allowing for continuous improvement.
Stay Disciplined and Adaptable
- Follow Your Plan: Stick to your strategy and avoid emotional decision-making. Discipline is crucial in trading.
- Adapt to Market Conditions: Be prepared to adjust your strategy based on changing market dynamics. Not every pattern will work in all market conditions, so flexibility is important.
Document Your Trades
Choose the Right Format
- Digital vs. Physical: Trading course, Decide whether you want to keep a digital journal (using spreadsheet software, dedicated trading journal apps, or a simple document) or a physical notebook. Digital formats offer easier data manipulation and backup options.
- Templates: Consider using pre-made templates designed for traders that include essential fields. This can save time and ensure consistency.
2. Include Essential Information
Ensure your trade documentation captures all relevant details:
- Date and Time: Record when you entered and exited the trade.
- Asset Details: Specify the asset traded (e.g., stock, forex pair, commodity) and the ticker symbol.
- Trade Type: Indicate whether the trade was long or short.
- Entry and Exit Prices: Document the price at which you entered the trade and the price at which you exited.
- Position Size: Note the number of shares, contracts, or lots traded.
- Stop-Loss and Take-Profit Levels: Record your stop-loss and take-profit orders to evaluate their effectiveness.
Conclusion
Creating a chart patterns trading strategy involves understanding patterns, setting clear rules, incorporating technical indicators, and managing risk effectively. By backtesting your strategy and practicing in a demo account, you can gain confidence and improve your approach. Remember, discipline and adaptability are key to long-term success in trading. With a structured strategy in place, you can harness the power of chart patterns to make informed trading decisions.